Let the AI Out: BLE + Serial — Using Both Interfaces at Once
This post is part of the Let the AI Out series on giving AI agents direct access to hardware. Start here for the overview.
In the BLE post, the agent learned to see the device from the outside — scanning, connecting, reading characteristics, subscribing to notifications. The wireless interface as a user would experience it.
In the Serial post, it got a seat at the device’s internal console — boot banners, debug logs, CLI commands, control lines. The developer’s view of what the firmware is actually doing.
In practice, many embedded devices expose both interfaces. BLE for the product surface, and a UART console for development and debug. When you’re building firmware, you constantly bounce between the two: test a BLE feature in one window, check the serial output in another, correlate what the device exposes with what it’s doing internally.
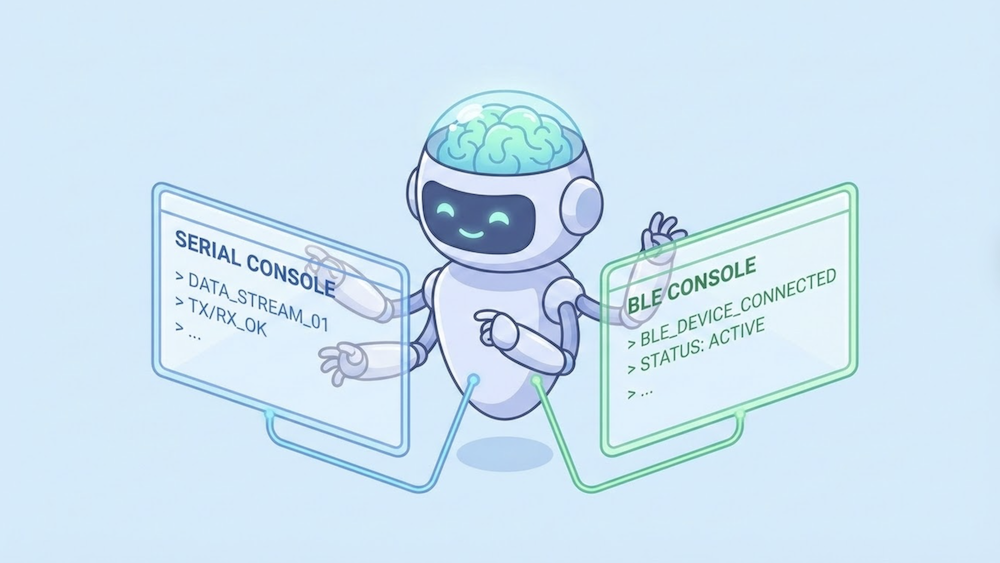
This post is about what happens when the agent can watch both at once.
What this is (and what to read first)
This is the fourth post in a series:
- What Is MCP? — the protocol underneath. Start here if MCP is new to you.
- BLE MCP Server — giving the agent access to Bluetooth Low Energy.
- Serial MCP Server — giving the agent access to the serial console.
This post assumes both servers are set up and focuses on using them together against the same device.
The demo setup (what the agent is talking to)
For this demo, I used a device that exposes both BLE and serial interfaces.
- A BLE peripheral (GATT server)
- A UART serial console (line-oriented CLI)
The agent connects to both interfaces via the BLE and Serial MCP servers.
Each interface exposes a different view of the same device:
Serial — a CLI with a > prompt. The agent can issue commands (status, battery, reboot, etc.) and see real-time debug logs.
BLE — GATT services advertised as HybridDemo:
- Device Information (0x180A) — model, firmware, serial number
- Battery (0x180F) — level with notifications
- Data Service (custom) — configurable sensor sampling (rate, count, start/stop, notifications)
Everything that happens over BLE is also logged to the serial console in real time: connects, disconnects, MTU negotiation, subscription changes, and data collection progress.
This gives the agent two complementary perspectives on the same behavior:
- BLE shows the device from the outside — what a remote client sees and experiences.
- Serial shows the device from the inside — what the firmware logs and reports about its own state.
The bug being exercised
The demo includes a deliberately injected firmware bug:
- The device uses a sensor lock to protect exclusive access to the ADC during data collection.
- At normal sampling rates, everything works fine.
- At high sampling rates (e.g., 100 Hz), the system becomes overloaded and the BLE connection drops due to a supervision timeout.
- The disconnect handler cleans up BLE state but forgets to release the sensor lock.
This leaves the device in a weird half-broken state:
- BLE reports the device as idle.
- New data collection requests fail.
- The only way to see the stuck lock is via the serial console.
- The only way to recover is to reboot the device.
This is a realistic class of bug: partial cleanup on error paths that only shows up when multiple subsystems interact under load.
The demo
Here’s a rough timeline of what happens, so you know what you’re looking at:
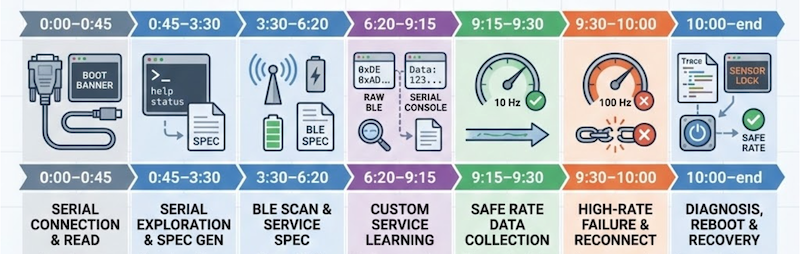
- 0:00–0:45 — Agent scans serial ports, connects, reads the boot banner.
- 0:45–3:30 — Agent explores the serial CLI and generates initial protocol specs/plugins.
- 3:30–6:20 — Agent scans for BLE devices, connects, reads services, and creates initial BLE specs/plugins.
- 6:20–9:15 — Agent explores the custom Data Service. It uses low-level BLE primitives and it compares raw BLE notification bytes with the clean, decoded values shown on the serial console to infer the data format. Updates the spec/plugin based on what it learned.
- 9:15–9:30 — Agent requests data at a safe rate (10 Hz) using the newly created plugin — everything works.
- 9:30–10:00 — Agent increases the sampling rate to 100 Hz. BLE connection drops mid-collection. Agent reconnects and attempts to start another collection — now it fails.
- 10:00–end — Agent inspects traces, notices the disconnect, then checks the serial console and sees the stuck sensor lock. It concludes the device is in a bad internal state and triggers a reboot via serial. After reboot, everything works again at safe rates.
What’s interesting here
What’s interesting here isn’t that the agent “found the bug.”
It’s that it could correlate two different views of the same failure and use one to reason about the other:
- BLE showed the external symptom: the connection dropped and notifications stopped arriving.
- Serial showed the internal state: a disconnect due to supervision timeout, incomplete cleanup, and a sensor lock left held.
The agent didn’t need to be told to check serial. Once BLE went silent, it looked for another source of truth, inspected the device logs, and figured out why the system was now stuck. It then chose a recovery action (reboot) and verified that the system returned to a healthy state.
Earlier in the session, it used the same dual view to decode the data service itself — comparing raw BLE notifications against the serial console’s human-readable output to infer the sample format and units before updating its spec and plugin.
This is exactly the workflow humans use today: one terminal for the product interface, another for debug logs, mentally correlating what the device exposes with what it’s doing internally. MCP just makes that workflow available to agents — continuously, statefully, and without copy/pasting logs back and forth.
Closing thought
Embedded debugging has always been a multi-surface problem.
You test the product interface in one place. You watch logs and poke internals in another. You mentally correlate what the device exposes with what it’s doing inside.
What MCP changes isn’t the nature of that work — it’s who gets to participate in it.
When the agent can see both the product surface (BLE) and the debug surface (serial) at the same time, it stops being just a code generator. It becomes a debugging companion that can observe behavior, correlate signals, try recovery actions, and learn from what the device does next.
That’s the direction this series is really about: letting AI leave the chat box and step into the loop.