Let the AI Out: Giving the AI Agent a Hardware Debug Probe
This post is part of the Let the AI Out series on giving AI agents direct access to hardware. Start here for the overview.
Serial MCP gave the agent the developer’s view — boot banners, debug logs, CLI commands. BLE MCP gave it the user’s view — scanning, connecting, reading characteristics.
Both are curated surfaces. Both are views the firmware chooses to present.
A hardware debug probe bypasses all of that.
It connects directly to the silicon — the core, the memory, the registers. If the firmware lies, the probe tells the truth. If the firmware crashes, the probe still answers.

This post is about giving that level of access to an AI agent — the same access you have when you’re at your most powerful: halted at a breakpoint, staring at the stack.
When abstractions fail, you drop to the metal. Now the AI agent can too.
What this looks like in practice
End-to-end demo: connecting to a real target, flashing firmware, halting execution, setting breakpoints, reading memory, using ELF for symbol resolution, and attaching SVD for register-aware inspection.
The server currently supports J-Link probes only. The architecture is backend-agnostic — OpenOCD and pyOCD backends are planned — but today, you’ll need a J-Link and the SEGGER J-Link Software installed separately.
What this is (and what to read first)
This is the fifth post in the series:
- What Is MCP? — the protocol underneath. Start here if MCP is new to you.
- BLE MCP Server — wireless interface access. Covers the poke→spec→plugin arc in detail.
- Serial MCP Server — serial console access. Covers PTY mirroring and line-oriented I/O.
- BLE + Serial Demo — using both interfaces together to debug a real device.
The Debug Probe MCP Server follows the same pattern: stateful MCP server, stdio transport, plugins, tracing. If you’ve read the earlier posts, the architecture should feel familiar.
MCP Server"] A -->|"MCP"| SER["⚙️ Serial
MCP Server"] A -->|"MCP"| BLE["⚙️ BLE
MCP Server"] DBG -->|"SWD/JTAG"| D["📡 Device"] SER -->|"UART"| D BLE -->|"BLE"| D style A fill:#2d1b69,stroke:#b794f4,stroke-width:2px,color:#fff style DBG fill:#4a1942,stroke:#f687b3,stroke-width:2px,color:#fff style SER fill:#4a1942,stroke:#f687b3,stroke-width:2px,color:#fff style BLE fill:#4a1942,stroke:#f687b3,stroke-width:2px,color:#fff style D fill:#1a365d,stroke:#63b3ed,stroke-width:2px,color:#fff
A quick primer on debug tools
If you’ve done embedded development, you know these tools well. If you haven’t, here’s the minimum context to follow the rest of the post.
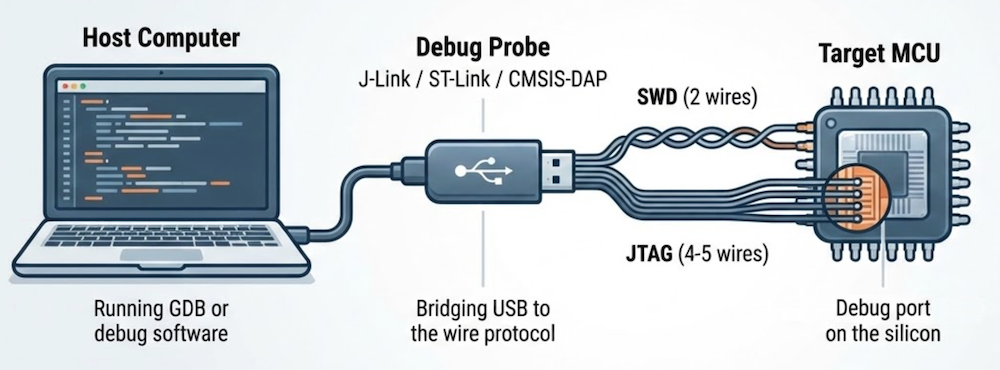
The debug port
Most modern microcontrollers have a dedicated debug port built into the silicon — a hardware interface designed specifically for development. The two common ones are:
- SWD (Serial Wire Debug) — two wires (clock + data). Used by most ARM Cortex-M chips.
- JTAG (Joint Test Action Group) — four or five wires. Older, more general.
Both provide direct access to the CPU’s internal state — a hardware feature that works even if the firmware is broken, stuck, or not yet flashed.
The debug probe
The debug port on the chip speaks a low-level wire protocol. To use it from a computer, you need a debug probe — a small piece of hardware that bridges USB to SWD or JTAG.
Common ones:
- J-Link (SEGGER) — the workhorse. Fast, reliable, widely supported. What this MCP server uses today.
- ST-Link — ships with every STM32 development board.
- CMSIS-DAP — an open standard. Used by many low-cost probes.
The debug software stack
The software that drives the probe is usually GDB (GNU Debugger) or a tool that speaks GDB’s protocol. The typical stack looks like this:
(debugger)"] -->|"GDB RSP
(TCP)"| B["⚙️ GDB Server
(J-Link, OpenOCD)"] B -->|"SWD
JTAG"| C["🔌 Target
MCU"] style A fill:#2d1b69,stroke:#b794f4,stroke-width:2px,color:#fff style B fill:#4a1942,stroke:#f687b3,stroke-width:2px,color:#fff style C fill:#1a365d,stroke:#63b3ed,stroke-width:2px,color:#fff
This MCP server replaces GDB in that stack — it talks directly to the GDB server, so the AI agent drives the debug protocol itself.
What you can do with it
Once connected — probe and software stack in place — you can:
- Control execution — halt, resume, single-step, breakpoints
- Inspect and modify state — read/write memory, registers
- Program and reset — flash firmware, soft/hard reset
- High-speed logging — RTT (Real-Time Transfer) over the debug wire itself, no UART needed
The agent’s development flow
Here’s what a typical session looks like when the AI agent has access to a hardware debug probe — from connecting through flashing, halting, and setting breakpoints.
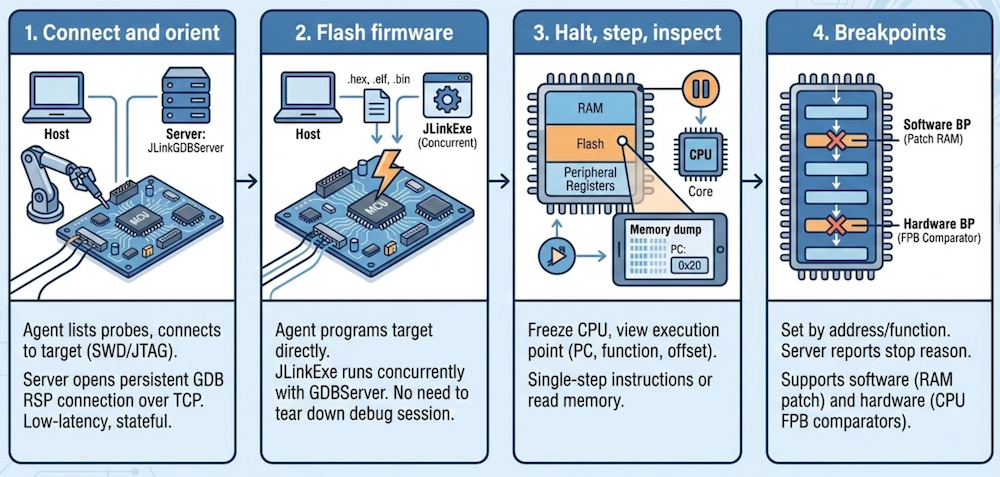
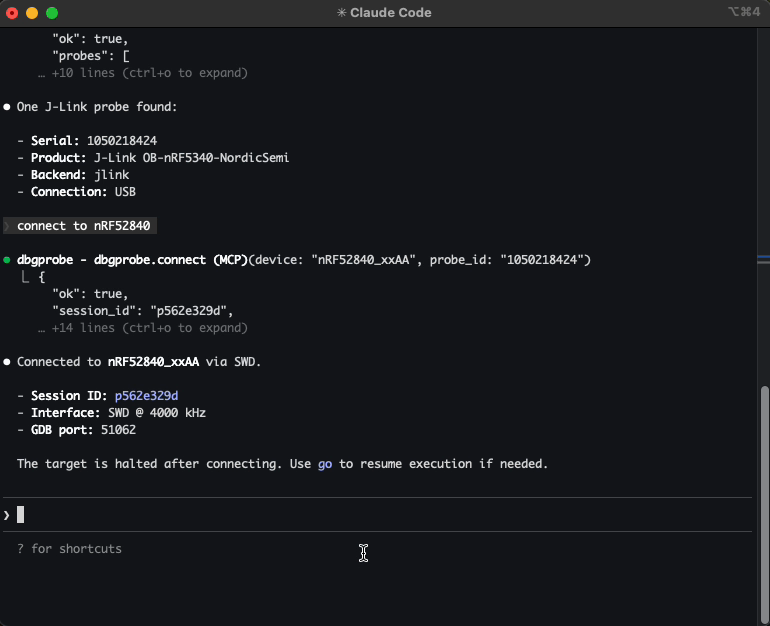
Connect and orient
The agent lists attached probes, picks one, and connects — specifying the target device, interface (SWD or JTAG), and clock speed. Behind the scenes, the server starts a JLinkGDBServer subprocess and opens a persistent GDB RSP connection over TCP. That connection stays open for the entire session — low-latency, stateful, ready for interactive debugging.
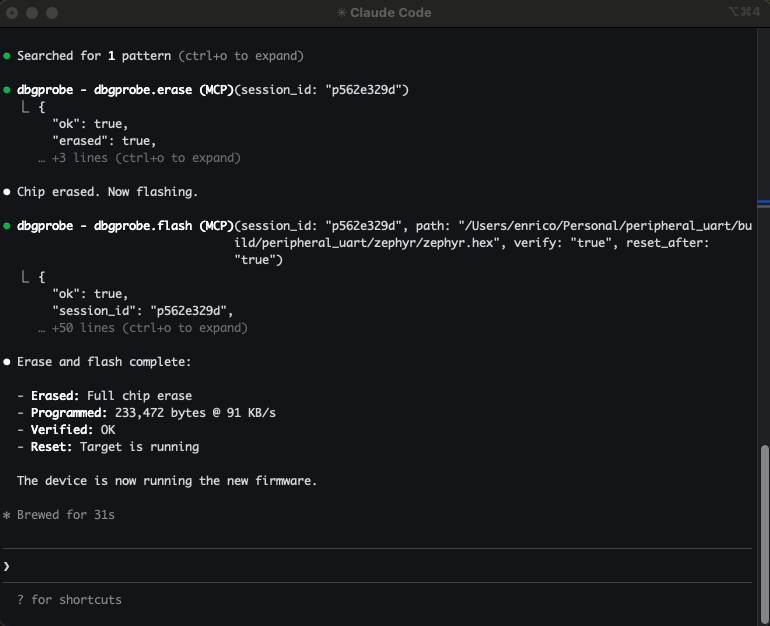
Flash firmware
The agent can program the target directly — .hex, .elf, and .bin files are all supported. When you flash an ELF, the server automatically parses the symbol table (more on that below).
Flashing uses JLinkExe under the hood rather than going through GDB — it’s more reliable and handles vendor-specific unlock sequences. From the agent’s perspective, it’s a single tool call: flash and continue.
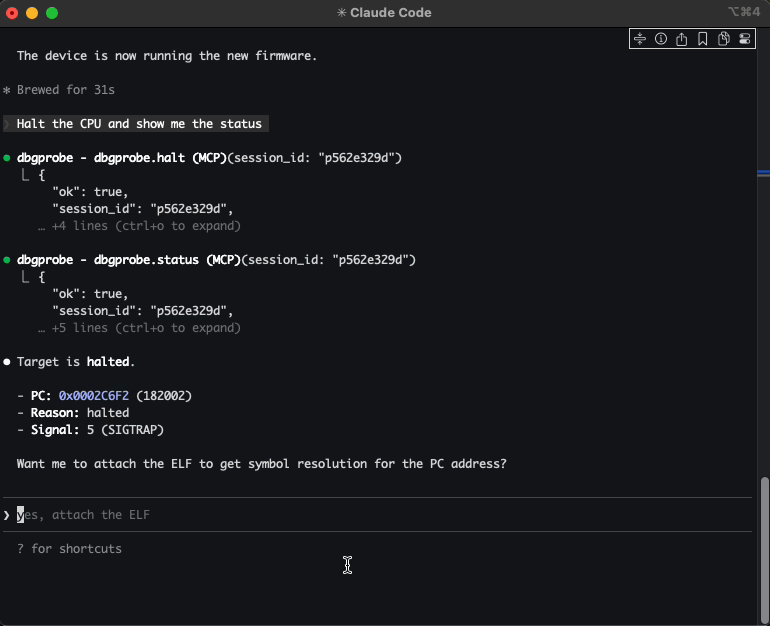
Halt, step, inspect
The agent can freeze the CPU and see exactly where execution stopped — the program counter, the current function, the offset within it. From there, it can single-step through instructions, or read memory directly: RAM, flash, peripheral registers, anything in the address space.
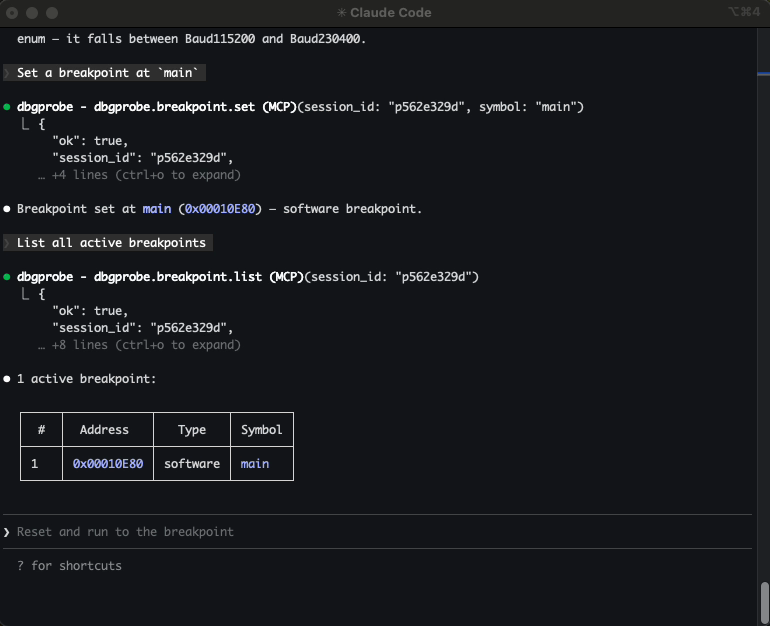
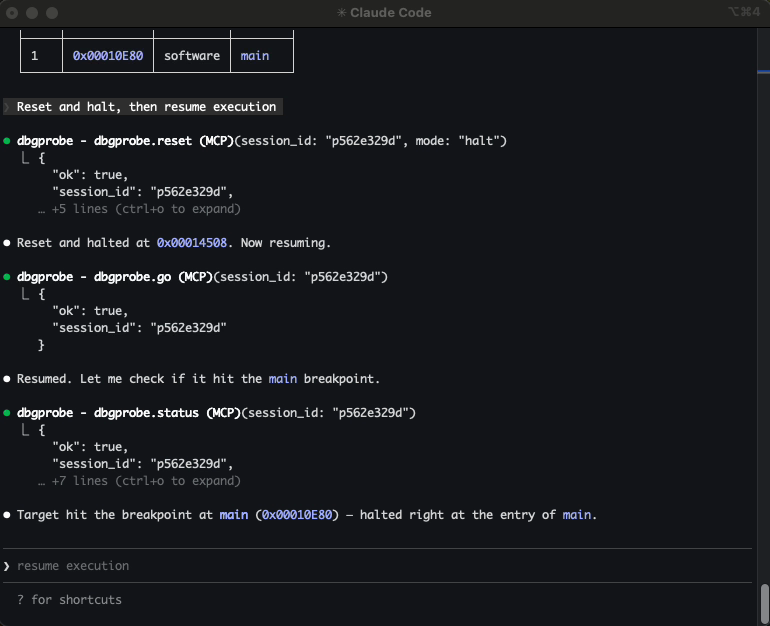
Breakpoints
The agent can set breakpoints by address or by function name (when an ELF is attached). Resume execution, and the target runs until the breakpoint fires. The server reports why execution stopped — software breakpoint, hardware breakpoint, manual halt, or something else.
When a workflow involves multiple steps — flash, wait for boot, set breakpoints, resume, check state — plugins let the agent run it as a single operation. The BLE post covers the poke→spec→plugin arc in detail.
ELF integration: the agent knows your symbols
ELF (Executable and Linkable Format) is the standard binary format produced by embedded toolchains — it contains compiled code, section layout, and the symbol table that maps addresses to function and variable names.
Raw addresses are useful. Function names are better.
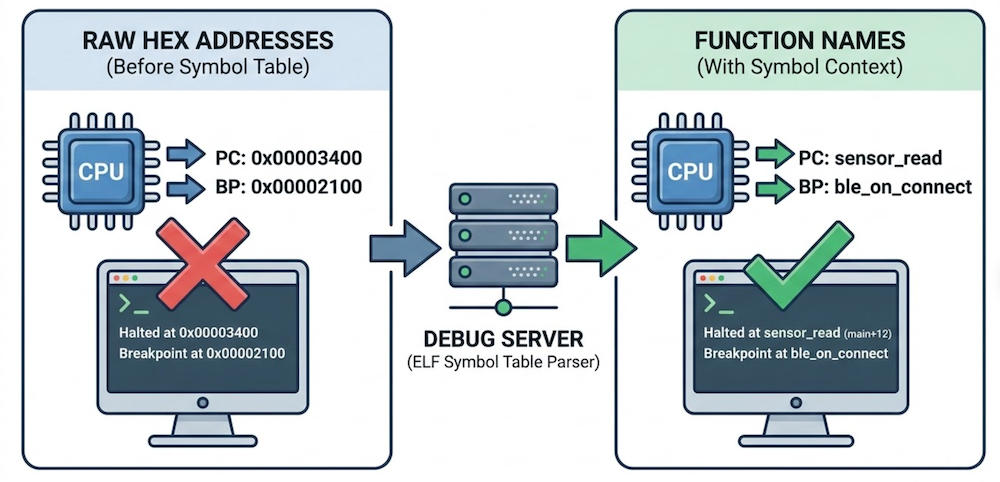
When you flash an ELF file or attach one to a session, the server parses the symbol table and enriches every response with symbol context. Halt the CPU and you don’t just get a raw program counter — you get main+12. Set a breakpoint by function name instead of a hex address. Look up a symbol and get its address, size, and type. Bidirectional, always available.
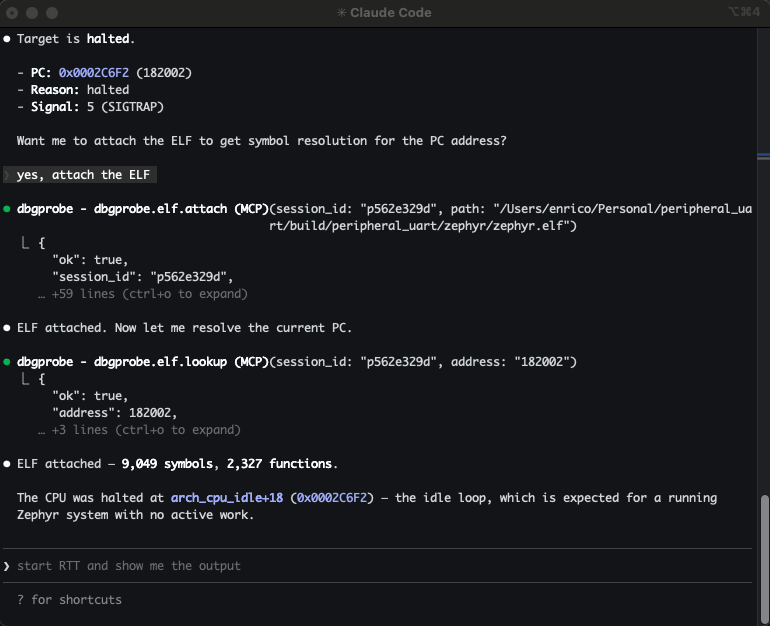
The agent reasons about your firmware in the same terms you do. Not “halted at 0x00003400” but “halted at sensor_read.” Not “breakpoint at 0x00002100” but “breakpoint at ble_on_connect.”
When the agent can map addresses to function names, it can form hypotheses about what the firmware is doing and why — not just report raw state.
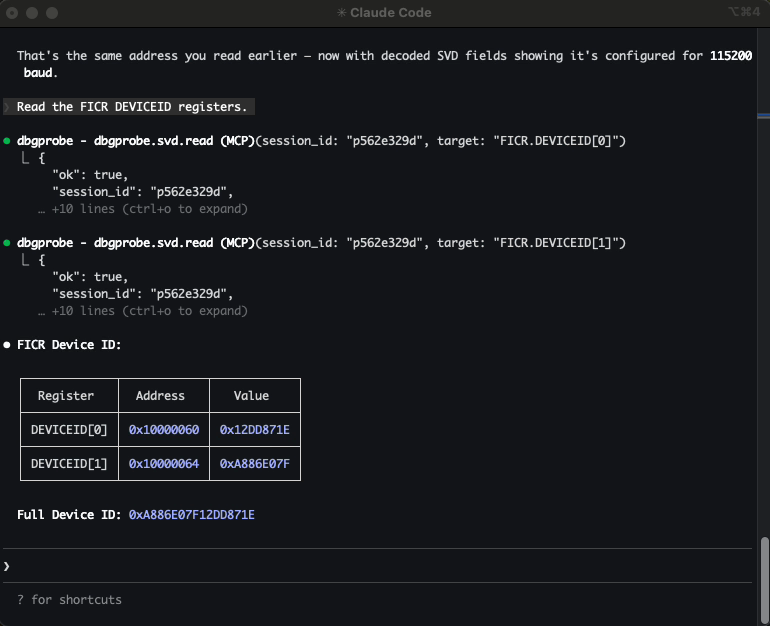
SVD integration: memory with meaning
An ELF file tells the agent about code — functions, symbols, addresses.
An SVD file tells it about hardware.
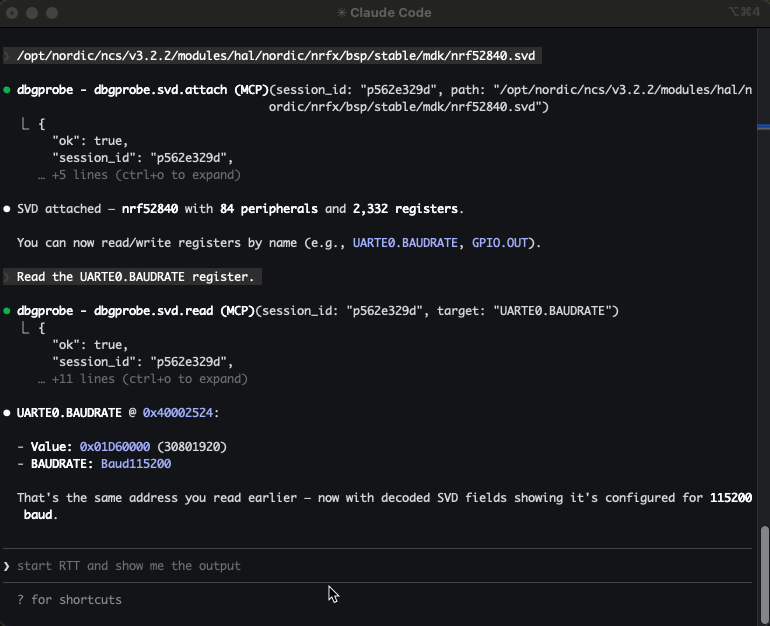
SVD (System View Description) files are XML descriptions of a microcontroller’s peripheral register map — peripheral base addresses, register names and offsets, bitfields, enumerations, access permissions.
Without SVD, reading 0x40014000 returns raw bytes. With SVD attached, the agent can ask for TIMER0.TASKS_START by name and get back the value, the bitfields, and what they mean.
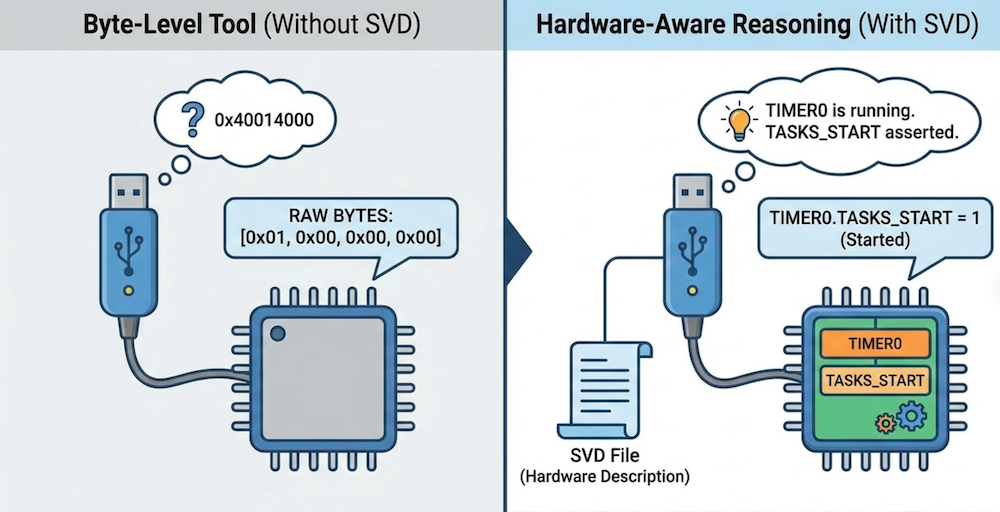
The agent doesn’t just see memory — it sees intent. Instead of guessing what 0x40014000 means, it can reason: TIMER0 is running. TASKS_START is asserted. That explains the interrupt storm.
SVD support turns the debug probe from a byte-level tool into a hardware-aware reasoning surface.
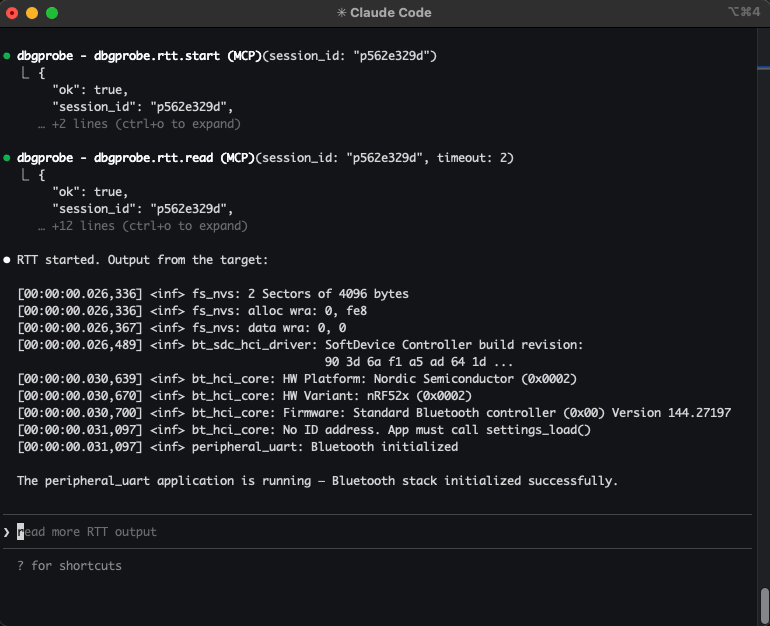
RTT: logging without a UART
RTT (Real-Time Transfer) uses the debug connection itself to stream data between the target and the host. The firmware writes to a small buffer in RAM; the probe reads it over SWD/JTAG in the background, without halting the CPU. No UART pins, no extra wiring, no baud rate configuration.
It sits in an interesting middle ground: not curated like a serial console, but not invasive like halting the core. The agent gets continuous visibility into firmware behavior while execution continues in real time.
Getting started
Install:
pip install dbgprobe-mcp-server
The MCP server does not include J-Link tools — you’ll need to install the SEGGER J-Link Software separately. The server auto-detects JLinkExe and JLinkGDBServer on your system. For personal projects and education, SEGGER offers the J-Link EDU Mini at a lower cost.
Not affiliated with or sponsored by SEGGER — it’s just what I had on my bench.
Register with Claude Code:
claude mcp add dbgprobe -- dbgprobe_mcp
Optionally set a default target device and enable plugins:
claude mcp add dbgprobe \
  -e DBGPROBE_JLINK_DEVICE=nRF52840_xxAA \
  -e DBGPROBE_MCP_PLUGINS=all \
  -- dbgprobe_mcp
For VS Code + Copilot, add to .vscode/mcp.json:
{
  "servers": {
    "dbgprobe": {
      "type": "stdio",
      "command": "dbgprobe_mcp",
      "env": {
        "DBGPROBE_JLINK_DEVICE": "nRF52840_xxAA"
      }
    }
  }
}
The tools will be available in Copilot Chat automatically.
Safety
The BLE post covers the safety philosophy in detail — anything that can affect real hardware is opt-in. A debug probe raises the stakes:
Memory writes affect real hardware. A write to the wrong address can corrupt device state, overwrite calibration data, or put the chip in an unrecoverable state. Be aware of what and where you let the agent write.
Flash operations are destructive. Flashing overwrites the chip’s program memory. If the new firmware is wrong, the device won’t boot. A mass erase will wipe all flash contents, including any data or keys stored on the device.
Plugins execute code with hardware access. Same as the other servers — plugins are opt-in, contained to the project directory, and should be reviewed before enabling.
Closing thought
Serial gives you what the firmware says. BLE gives you what it advertises. A debug probe gives you what it’s actually doing — instruction by instruction, register by register, byte by byte.
That changes what kind of problems it can help with. Not just “write the firmware” — but “the device hangs after five minutes, find out why.” Set a breakpoint, wait for it to trigger, inspect the stack, read the peripheral registers, form a hypothesis, test it. The same loop an engineer runs — but automated, repeatable, and stateful.
This doesn’t replace the engineer. It extends the engineer — with structured tools that drive the debug protocol directly, not text scraped from a CLI.
It gives the agent the same level of access you have when you’re at your most powerful — at the probe, halted at a breakpoint, staring at the stack.
When abstractions fail, you drop to the metal. Now the AI agent can too.